Overview
The platinum group metals consist of six elements that are characterized by similarity, namely platinum, iridium, osmium, rhodium, ruthenium and palladium. Based on their densities, the first three are categorized as heavy, while the last three are regarded as light. PGMs are superb catalysts in addition to other characteristics like corrosion resistance, high melting points and chemical stability. It is precisely these characteristics that make PGMs highly desirable in many applications. Currently, the single largest market for the three most important PGMs (i.e. platinum palladium and rhodium) is the automotive sector, specifically the catalytic converter industry. PGM resources are rare and 80% of the world’s platinum reserves are located in South Africa (Adapted from Department of Research and Information, 2013).

Figure 1: Two Rivers Mine In South Africa
Applications
The leading demand for PGMs continued to be catalytic converters to decrease harmful emissions from automobiles. PGMs are also used in the glass industry; in jewelry; in the chemical industry for catalysts in nitric acid and other bulk-chemical production, for refining petroleum, and for fabricating laboratory equipment; and in the electronics industry in computer hard disks to increase storage capacity, in multilayer ceramic capacitors, and in hybridized integrated circuits. Platinum and palladium, along with gold-silver-copper-zinc alloys, are used as dental restorative materials. Platinum, palladium, and rhodium are used as investment in the form of exchange-traded products, as well as physical bars and coins (Adapted from US Geological Survey, 2015). According to Department of Research and Information (2013), PGMs demand are distributed as following: autocatalysts (39%) and industrial applications (22%), Jewelry 31% and investment demand (8%), particularly through exchange traded funds (ETFs).

Figure 2: Downstream applications of PGM
Geology and Key Producing Regions
There are broadly considered to be four main types of economic PGM mineral deposits (Adapted from Mudd and Glaister, 2009 and Vermaak, 1995):
- Norite intrusions: Where meteoritic impact has been instrumental in PGM emplacement; eg. Sudbury Irruptive Complex in Ontario, Canada (~10-1000 Mt, 1-3 g/t, ~2-3% Ni+Cu);
- Stratiform deposits: Where PGMs occur in large Pre-Cambrian mafic to ultramafic layered intrusions, such as the Merensky and Upper Group 2 Chromitite (UG2) Reefs of the Bushveld Complex in South Africa, Great Dyke in Zimbabwe and the Stillwater complex in Montana, United States (usually ~10-1000 Mt, grade 3-10 g/t PGMs, ~0.2-1% Ni+Cu);
- Ni-Cu bearing sills: Related to rift structures and concordant intrusive sheets, eg. Noril’sk-Talnakh District, Russia, and Jinchuan deposits, China (~10-1000 Mt, 5-10 g/t, ~3-5% Ni+Cu);
- Placer deposits: Alluvial deposits containing coarse PGMs (mainly Pt) were mined with alluvial gold for ~2,000 years prior to the 20th century . Columbia produced 1.4 t alluvial Pt in 2007;
However, most of the primary PGM’s come from low-sulfide platinum ores (South Africa and the U.S.A) and from sulfide copper-nickel ores (Russian and Canadian deposits).
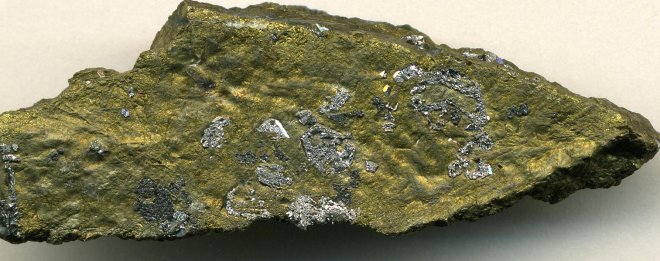
Figure 3: Sperrylite (Silver-colored) in platinum-copper ore
World resources of PGMs are estimated to total more than 100 million kilograms. The largest reserves are in the Bushveld Complex in South Africa. South Africa has over 80% of global PGM reserves, with Zimbabwe holding a further 7% and Russia 8%, with the three countries claiming 95% of global reserves.
World mine production of PGMs was 393,000 kg in 2014 (decreasing by about 14% from 455,000 kg in 2013). South Africa accounted for 48% of total PGM mine production in 2014; Russia, 30%; Canada, 7%; Zimbabwe, 7%; the United States, 4%; and other countries, 3%. In 2014, world platinum mine production decreased by 21%. In South Africa, which accounted for 64% of world platinum production, production totaled 94,000 kg of platinum, a 28% decrease from that in 2013, accounting for most of the decrease in global production. Global mine production of palladium in 2014 decreased by 5% to 193,000 kg, with Russia and South Africa accounting for 43% and 30%, respectively, of production; Canada and the United States accounting for 10% and 6%, respectively; and Zimbabwe accounting for 5%. World mine production of other PGM s (iridium, osmium, rhodium, and ruthenium) decreased by 21% in 2014 compared with that of 2013. South Africa, which accounted for 71% of global production, accounted for most of the decrease of other PGMs. Estimated production in Russia, the second leading producer, remained unchanged (Adapted from US Geological Survey, 2016).
Mining and Processing
The mining of PGM ores is through conventional underground or open cut mines. The next stage is grinding and gravity-based (or dense media) separation, followed by flotation to produce a PGM-rich concentrate. The concentrate is then smelted to produce a PGM-rich Ni-Cu matte, with the PGMs extracted and purified at a precious metals refinery. The processing is therefore more analogous to base metals rather than Au-Ag mills which use cyanide-based hydrometallurgy. Smelting of Ni-Cu concentrates can also be a modest source of PGMs (eg. Russia, Canada). (Adapted from Mudd and Glaister, 2009).
Most of the PGM mines in South Africa operate at a depth below 500 meters and up to 2 kilometers. Their orebodies are tabular and narrow, varying in width between 0.9 meters and 2.1 meters and requiring labor-intensive mining techniques. PGM ore is drilled and broken with explosives before being removed through mechanical transportation methods to the surface; electricity consumption is high, not only for ore haulage but also to drive compressed air to the miners’ hand-held pneumatic drills and, because the hard rock in platinum mines has a high thermal gradient, to refrigerate the working areas. On the surface the ore is crushed and milled into fine particles. Wet chemical treatment known as froth flotation produces a concentrate which is dried and smelted in an electric furnace at temperatures over 1,500°C. A matte containing the valuable metals is transferred to converters to remove iron and sulfur. PGMs are then separated from the base metals nickel, copper and cobalt, and refined to a high level of purity using a combination of solvent extraction, distillation and ion-exchange techniques (Adapted from IPA, 2013).

Figure 4: Generic flow chart for PGM production in South Africa
Key Issues (Adapted from Vronsky, 1997)
The annual supply of platinum is only about 130 tons – which is equivalent to only 6% (by weight) of the total Western World’s annual mine production of gold. All the platinum ever mined throughout history would fill a basement of less than 25 cubic feet.
Approximately, 10 tons of ore must be mined – sometimes almost a mile underground at temperatures greater than 120 degrees Fahrenheit – to produce one pure ounce of the “so-called white gold.” Furthermore, the total extraction process takes six long months. Also, production is concentrated in very few sites around the world.
Unlike gold, there are no large inventories of above-ground platinum. Therefore, any breakdown in the two major supply sources would catapult the price of platinum into orbit.
Market
The performance of the automobile industry will have the greatest impact on future consumption of these PGM s. Global automobile production is expected to increase, particularly in emerging markets, such as China and India, as well as in developed markets in the United States and Europe. In the electronics industry, palladium demand is expected to increase owing to increased demand for electronic items, such as tablets and other mobile devices, as well as a continued demand for laptop and desktop computers. The demand for platinum in the jewelry industry is expected to increase, especially in China, owing to lower prices (U.S. Geological Survey, 2016).
According to The World Platinum Investment Council (Platinum Quarterly), Global platinum demand is projected to increase to 8,255 koz during the full year 2016 – up from 8,220 koz in 2015. Growth is being powered by strong investment demand, forecast to rise to 350 koz in 2016; assisted by booming demand in Japan. Jewellery consumption is expected to increase by 1% during the full year, with growth in India, the US and Europe offsetting weaker demand elsewhere. Automotive demand is forecast to remain largely similar to 2015, down only 1% from the previous year. On the supply side the estimate of the amount of total mining supply and recycling for the full year has been reduced by 230 koz. Total supply is forecast to decrease by 1% to 7,800 koz this year, lower than the pre-strike level of 2013, as lower refined production from South Africa and Russia outweighs increases in other regions and from recycling. Refined supply is forecast to be 5,895 koz in 2016, with total mining supply at 5,995 koz with some sales from producer inventory expected. Platinum recovered via recycling is estimated to increase by 95 koz (+6%) to 1,805 koz, with secondary supply from autocatalysts growing to 1,305 koz (+10%), rebounding as volumes recover alongside the improvement in metal prices.
This month (July, 2016) palladium is up 16 per cent to $697.92 a troy ounce, while platinum has risen 11 per cent to $1,138 a troy ounce (Sanderson, 2016).
Have you been inside a deep underground platinum mine? See the video below for some insights.
Kind regards,
Ronaldo
Follow me on twitter @rcrdossantos
References:
Department of Research and Information “Industry analysis: Opportunities for downstream value addition in the platinum group metals value chain: Fuel cells”, Industrial Development Corporation of South Africa Limited. (February 2013). Last accessed on 07/31/2016 at http://idc.co.za/images/2015/PGMsMetalsValueChain.pdf
C.F. Vermaak, “The Platinum-Group Metals – A Global Perspective”, Mintek, Randburg, South Africa, 247p, 1995.
Mudd, G M and Glaister, B J, “The Environmental Costs of Platinum-PGM Mining: An Excellent Case Study In Sustainable Mining. Proc.“ 48th Annual Conference of Metallurgists”, Canadian Metallurgical Society, Sudbury, Ontario, Canada, August 2009.
U.S. Geological Survey, “2014 Mineral Commodity Summaries”. U.S. Department of the Interior. (January, 2015). Last accessed on 07/31/2016 at http://minerals.usgs.gov/minerals/pubs/commodity/platinum/mcs-2015-plati.pdf
U.S. Geological Survey “2014 Minerals Yearbook”. U.S. Department of the Interior. (January, 2016). Last accessed on 07/31/2016 at http://minerals.usgs.gov/minerals/pubs/commodity/platinum/myb1-2014-plati.pdf
International Platinum Group Metals Association (IPA) “The Primary Production of Platinum Group Metals (PGMs)”. International Platinum Group Metals Association, Munich – Germany. (2013). Last accessed on 07/31/2016 at http://ipa-news.com/assets/sustainability/Primary%20Production%20Fact%20Sheet_LR.pdf
Vronsky, I. M, “Platinum: The Rich Man’s Gold”, Gold-Eagle Website, May 1, 1997. Last accessed on 07/31/2016 at http://www.gold-eagle.com/article/platinum-rich-mans-gold
Sanderson, H, “Platinum, palladium chase down gold’s stellar showing”, Financial Times, Commodities, Website, July 2016, 2016. Last accessed on 07/31/2016 at http://www.ft.com/cms/s/0/79c5652a-54b8-11e6-befd-2fc0c26b3c60.html#axzz4G0WwDatq
Photos Credit:
Feature: An assortment of nuggets of native platinum. Author: Aram Dulyan
Figure 1: Two Rivers mine in South Africa. Author: Ryanj93
Figure 2: Downstream applications of PGMs. Author: Platinum Beneficiation Committee
Figure 3: Sperrylite (silver-colored) in platinum-copper ore. Author: James St. John.
Figure 4: Generic flow chart for PGM production in South Africa. Author: Lonmin
